How we analyze the accuracy of our recommendations
For our model to be effective, we need to avoid
overfitting and ensure that the
out-of-sample error is minimized. For this, our model uses
cross validation during the training process.
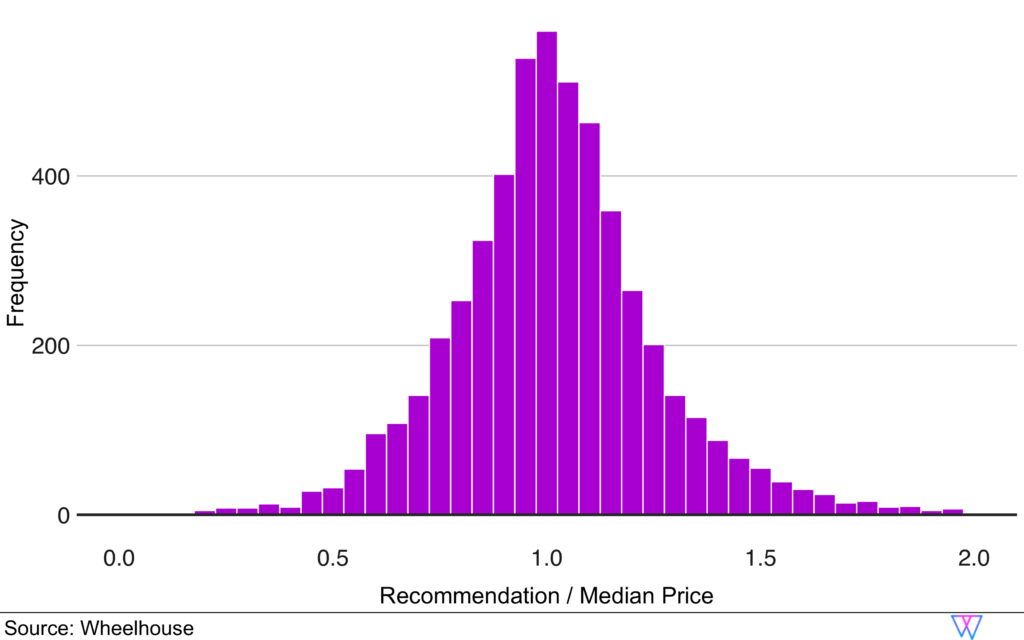
In our example of San Francisco, we train the Base Price Model using data from more than 5,000 units through the steps laid out above. A majority of units will have prices close to the right Base Price, while some will be priced too high or too low.
The below image is a histogram chart of a unit’s recommended prices relative to their current median price.
As you can see, most recommendations are pretty similar to the median price, i.e. have a value close to 1.0 (or 100%). However, a few units are currently underpriced and would get a recommendation as high as twice their current price, i.e. 2.0, while others are currently overpriced and would get a recommendation as low as 30% of their current price, i.e. 0.3.
The histogram shows that our Base Price Model