How we determine which units are competing with you for guests
In the STR space, automatically detecting an accurate competitive set can be quite challenging. This is due to the highly variable supply of the STR space, that sometimes creates non-intuitive competitive sets.
For example, it is not unusual to have a 1 BR unit that can sleep 4 (or even more!) guests. Due to this, it would not be unusual to find that an ‘accurate’ competitive set for this unit would include 1BR, 2BR, or even 3BR units.
Additionally complicating matters is the fact that many ‘similar’ nearby units may not actually be true competitors. (Said differently, not all 1BR places are the same!) This can be due to neighborhood boundaries, differing amenities, reviews, or more. For example, if your unit has a pool, your competitive set should likely include (at least in the summertime!) nearby units that also have pools.
Given this complexity, we have found that the most effective Competitive Set can be determined by determining which units have the most similar combination of features and booking patterns.
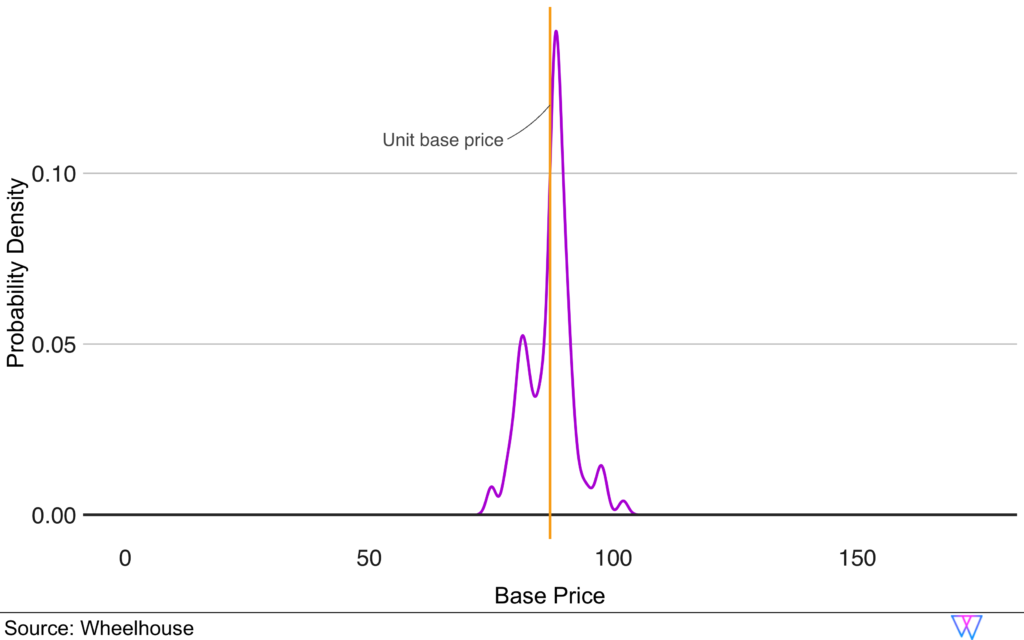
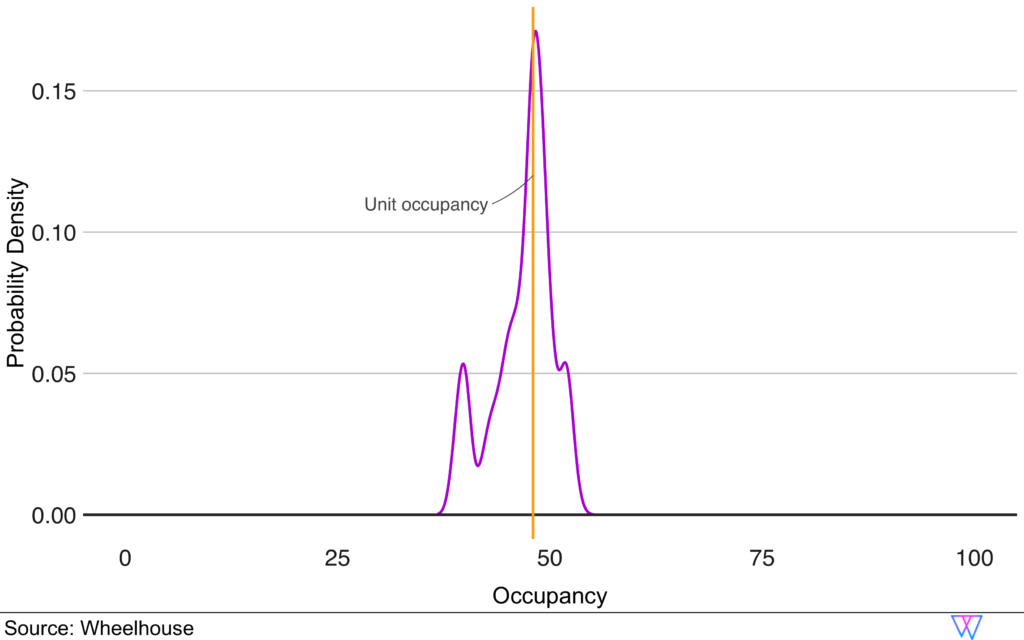
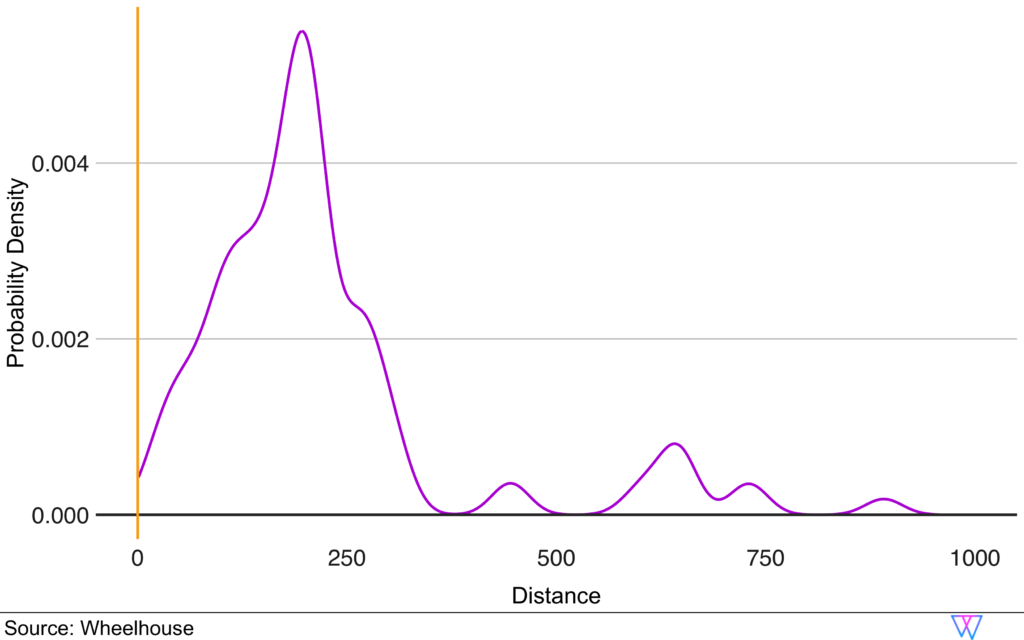
Our recommendation engine creates Comp Sets by pairing our Base Price Model (which implicitly identifies similar properties) with an Occupancy Model. We train this model in a similar fashion as our Base Price Model, to predict the occupancy of a unit. Additionally, we take the geographical distance between units into account.
In this manner, we have an expected base price, as well as an expected occupancy, for each unit in a market. However, this approach abstracts from the unit features to a more generic comparison that implicitly values similarities in e.g. amenities, bedrooms and location based on how they perform in the market.
Utilizing the differences in base price, expected occupancy, and geographic distance, we then perform a
cluster analysis to identify the final recommended competitive set.
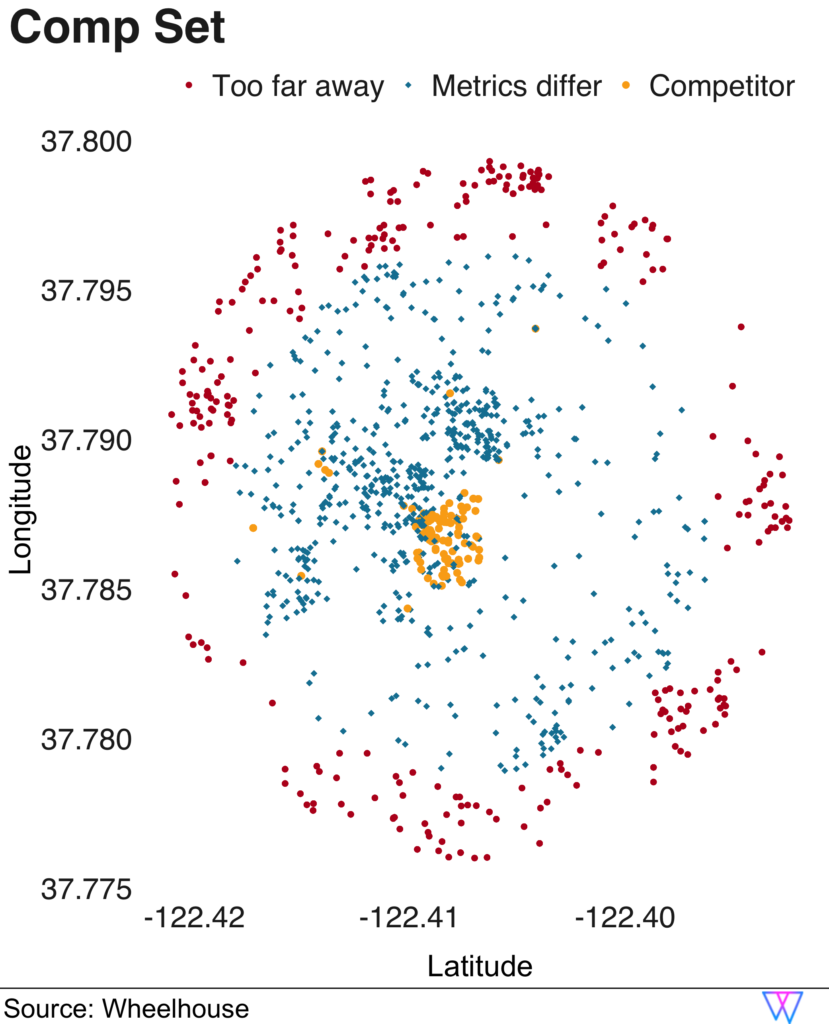
To explore this Comp Set model, let us take a sample ‘private room’ in downtown San Francisco, with zero bedrooms, i.e. a studio, and one bathroom that sleeps two.
In this case, our Comp Set model identifies a competitive set of 90 units. Among this competitive set, 68 units are also zero bedrooms, while the other 32 have one bedroom. And, while 74 of the units are also classified as ‘private rooms’, 16 of the units are entire homes/apartments.
The results are shown in the following visual, which depicts each nearby unit as a singular dot.