RevPAR: What it means, how to calculate it, and a good RevPAR index

November 6, 2022 | Hailey Friedman

Owning a hotel or other short-term rental property can be a safe investment, but it’s not free of uncertainties. And since the pandemic shook the travel industry, the slow return of tourists has led to more cautious property managers (though occupancy numbers have been returning to pre-pandemic times). 

Property and revenue managers are increasingly relying on key performance indicators (KPIs) to analyze rental business performance and make strategic decisions. One of these metrics is RevPAR, or revenue available per room.

RevPAR is used in the hospitality industry to calculate the revenue that can be generated per room, whether or not it’s occupied. 

In this article we’ll cover how to calculate RevPAR, what a good RevPar is, and why it’s so important for revenue management.

What is RevPAR?

RevPAR

RevPAR is an acronym for revenue per available room. It’s a performance metric calculated by taking the total amount of revenue generated by a property, like a hotel, and dividing it by the total number of available rooms. 

This does not include rooms designated for the hotel’s staff or for common facilities, since those are not available for rental income. 

RevPAR illustrates a property’s ability to fill its available rooms at an average rate. This can help property managers better understand the performance of their property. RevPar can also be the cornerstone to compare properties of a similar caliber, which also applies to short-term rentals.

Why is RevPAR important?

High seasons bring tourists and with their higher volume comes a higher revenue, but in low seasons that volume is going to drop. Lower demand means prices will have to change, and knowing the revenue per available room helps revenue managers to price those rooms accordingly. 

RevPAR also uses two important metrics for its calculation: average daily rate and occupancy rate. Your average daily rate is the average rental revenue earned for occupied rooms each day, and the occupancy rate is what percentage of rooms are occupied. 

Calculating and understanding all three of these measurements creates a more complete view of the property’s performance. 

It’s also important to note that reaching and maintaining a positive RevPAr index can even be a contract requirement for property and revenue managers, so it’s important to understand the complexities of this metric.

RevPAR Formula: How to Calculate RevPAR

RevPAR revenue

The RevPAR is an average distribution of the revenue made by renting out a portion of the rooms available. 

There are a few ways to calculate RevPAR:

  1. Total revenue ÷ Rooms available for rent: The total rental revenue made in a period of time (weeks, months) is averaged across the rooms available, whether they were sold or not.
  2. Room revenue ÷ Rooms available for rent: Similar to the formula above, this version considers the room revenue made within a specific time period. 
  3. Average daily rate (ADR) × Rooms occupied: Average daily rate is the total room revenue divided by the number of rooms sold. That average is then multiplied by the number of rooms that were occupied to get RevPAR. 


RevPAR Example

Let’s say you manage a 230-room hotel with 200 rooms open for guests. One-hundred and fifty of the 200 rooms are occupied, at a 75% occupancy rate, or .75. The average daily rate of those 150 rooms is USD$300 per night. 

So using the RevPar formula of RevPAR = Average Daily Rate x Rooms Occupied, your calculation will look like: 

( 300 × 0.75 ) = 225

This means that the hotel’s RevPAR is 225. This result can be accurately extrapolated for weekly or monthly periods.

What is a good RevPAR?

There is no “perfect” RevPAR rating. Given that every property and every market is different – and that all markets are in a constant state of change – there isn’t a “catch-all” level of the average room rate, formula, or target number to be reached.

While an increase in a property’s RevPAR means that its average room rate or its occupancy rate is improving, it does not necessarily mean better performance. RevPar doesn’t consider the size of the hotel or any additional profitability measures. 

However, there is a “good” RevPAR index to aim for.

RevPAR vs RevPAR Index

What is the RevPAR Index? An index is a measure that represents your market of interest. It tells you how good you are doing relative to that competition expressed in a percentage that should strive to be as close to 100% (or higher) as possible. 

The RevPar index or Revenue Generating Index (RGI) measures a hotel’s RevPAR performance relative to an aggregated grouping of hotels similar to the property you’re analyzing. If all things are equal, a property’s RevPAR Index, or RGI, should be 100. 

This comparison should always be made against properties in the same category. Whatever the rental property you manage, no matter how hard you work to please your guests, if your business is mid-level you should compare it with other mid-level lodging properties, not 5-star hotels, or 1-star motels. 

After establishing both your RevPAR and your direct competitor’s RevPAR, you can calculate the RevPAR Index.

        RevPAR Index = (RevPAR / Competition’s RevPAR) × 100

Is your RevPAR index more than 100? You’re beating out your competitors. Less than 100? Time for some strategic improvements.

How to Increase Your RevPAR Index

In order to increase the RevPAR Index for your property, you’ll have to make changes that distinguish you from your competition. For example, if there are hotel supplies or services (like electricity) that have become more expensive, both you and competitors might be increasing your average daily rates. In that case, your RevPAR Index wouldn’t change because both of your RevPARs proportionally stay the same. 

So how can you improve your RevPAR Index? You’ll need to either increase your occupancy rates, the average spend of your clients, or both.

revpar Index

Issues with RevPAR

While RevPAR is a helpful metric, it isn’t the only metric to track. If you only focus on RevPar, you won’t take into profitability or property size. It also ignores CPOR (costs per occupied room) and ancillary revenue. That’s why an increase in RevPAR doesn’t necessarily guarantee better performance or an increase in profitability.

So to really understand performance, it’s necessary to review other available KPIs.

What are Alternative Metrics to RevPAR?

RevPAR is an important metric, but it’s not the whole story. Here are some additional metrics property owners and managers should review.

  1. ADR 

    This is the average daily rate, which is the average of the total revenue made by every occupied room within a day. It’s calculated by taking the total revenue from sold rooms and dividing it by the number of those rooms. It takes into all rooms from the highest-paying suites to the single queens. 

    The formula to calculate the average room rate formula is as follows:

        ADR = Total revenue from rooms  / Number of rooms sold

    Rooms occupied by employees are excluded because they are not available for sale in this distribution, so they won’t generate income. If there are complementary rooms, they must be excluded too, because they also don’t add to the earnings.

    Despite being a helpful piece of information to correctly manage and gauge the performance of a property, ADR has its limitations. The measurement to get the average room rate formula can only be calculated after the fact (making it a lagging metric) and only takes into account the rented rooms.

  2. TrevPAR

    The TrevPAR acronym stands for total revenue per available room. It indicates how good your property is at generating revenue. It considers every room whether or not they’ve been sold. 

    It is calculated employing the next formula:

    TrevPAR = Total revenue / Available rooms

    While it’s similar to RevPAR, TrevPAR provides a global picture of overall performance by factoring in all revenue, not just the revenue generated by rooms. It includes potential amenities, add-ons, or ancillary services customers could potentially spend money on. 

    To improve TrevPAR, you can offer ancillary services, like: 

3. GOPPAR

Similar to a country’s GDP (gross domestic product), GOPPAR is the gross operating profit per available room. It demonstrates the relationship between the revenue of a rental and its expenses. 

The “gross operating profit” refers to the total revenue minus operating costs (like paying staff, marketing, utilities, and other similar expenses).

The formula is: 

        GOPPAR = Gross operating profit / Available rooms

GOPPAR compares how much money you’re making against how much it costs to run the business. It helps depict the actual performance of your business. 

4. ARPAR

ARPAR means adjusted revenue per available room and it’s just that: an adjustment. It’s calculated by taking the average daily rate (total revenue from rooms  / number of rooms sold) and subtracting variable costs like toiletries, cleaning supplies, breakfast, and any other expense directly related to hosting your guests. 

Then, any additional revenue (from upsells or ancillary services) will be added. This total number is then multiplied by the occupancy rate.

The formula looks like this:

      ARPAR = (ADR – variable costs + additional revenue) × occupancy rate

Knowing the adjusted revenue per available room provides a comprehensive grasp of your business’s profitability since it considers additional revenue and the costs of filling your rooms. 

However, it does exclude fixed costs like electricity, internet, and other factors. It’s also important to remark that “variable costs” and “additional revenue” are considered per sold room.

Boost Your RevPAR with Wheelhouse

revPAR boost

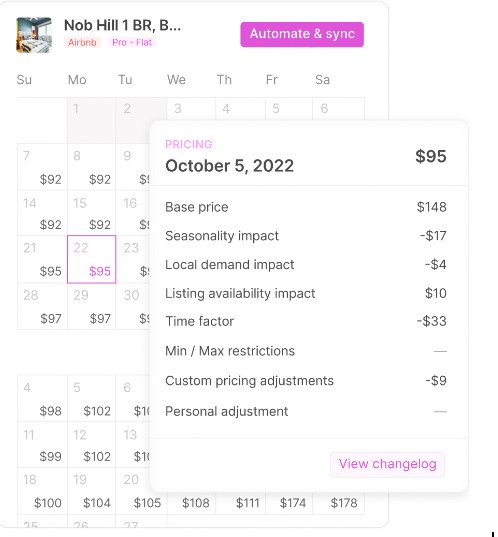
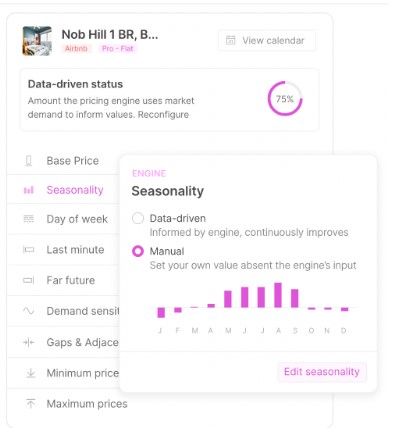
RevPAR (along with other KPIs) is an important metric when it comes to assessing a hotel’s performance. Knowing how to juggle these variables and pricing accordingly is vital in any competitive market to boost profitability. And ultimately, Wheelhouse can help with that.

Wheelhouse software analyzes 10 million data points every night to determine the optimal pricing for your short-term rental or hotel. Use our rule-based and strategy-driven pricing engine to see more revenue and save time. 

We’re the only team with Ph.D Data Scientists designing hotel-level pricing tools for short-term rentals. To learn more about how this software can help you increase your bottom line, try Wheelhouse today!

TAGS:

Blog search

Recent posts

Popular Tags