Keep owners confident with clear, shareable insights

A visual reporting suite for your whole team
Design reports that get read
Create reports that fit the way you think. Combine charts, metrics, and notes in any layout to highlight what matters most
Choose data, add insight
Compare sources, surface trends, and see performance in context so every decision is grounded in real understanding.
Comment, collaborate, continue
Export polished PDFs or publish interactive snapshots that invite feedback, spark discussion, and keep teams and clients aligned.
Report Builder
Design reports your owners will actually read
Chart library
Use up to nine different chart types including: KPI, Column, Bar, Donut, Line, Area, Heatmap, Table, Combo, and Multi-Metric charts.
Customizable report layouts
Every report on Wheelhouse has fully customizable layouts you can drag, drop, or resize to showcase the insights that matter most.
Define once, use everywhere
One report, endless perspectives. Effortlessly toggle between listings, markets, and dynamic sets to see every angle of performance.
Robust data
Select the right data, then add narrative & strategy
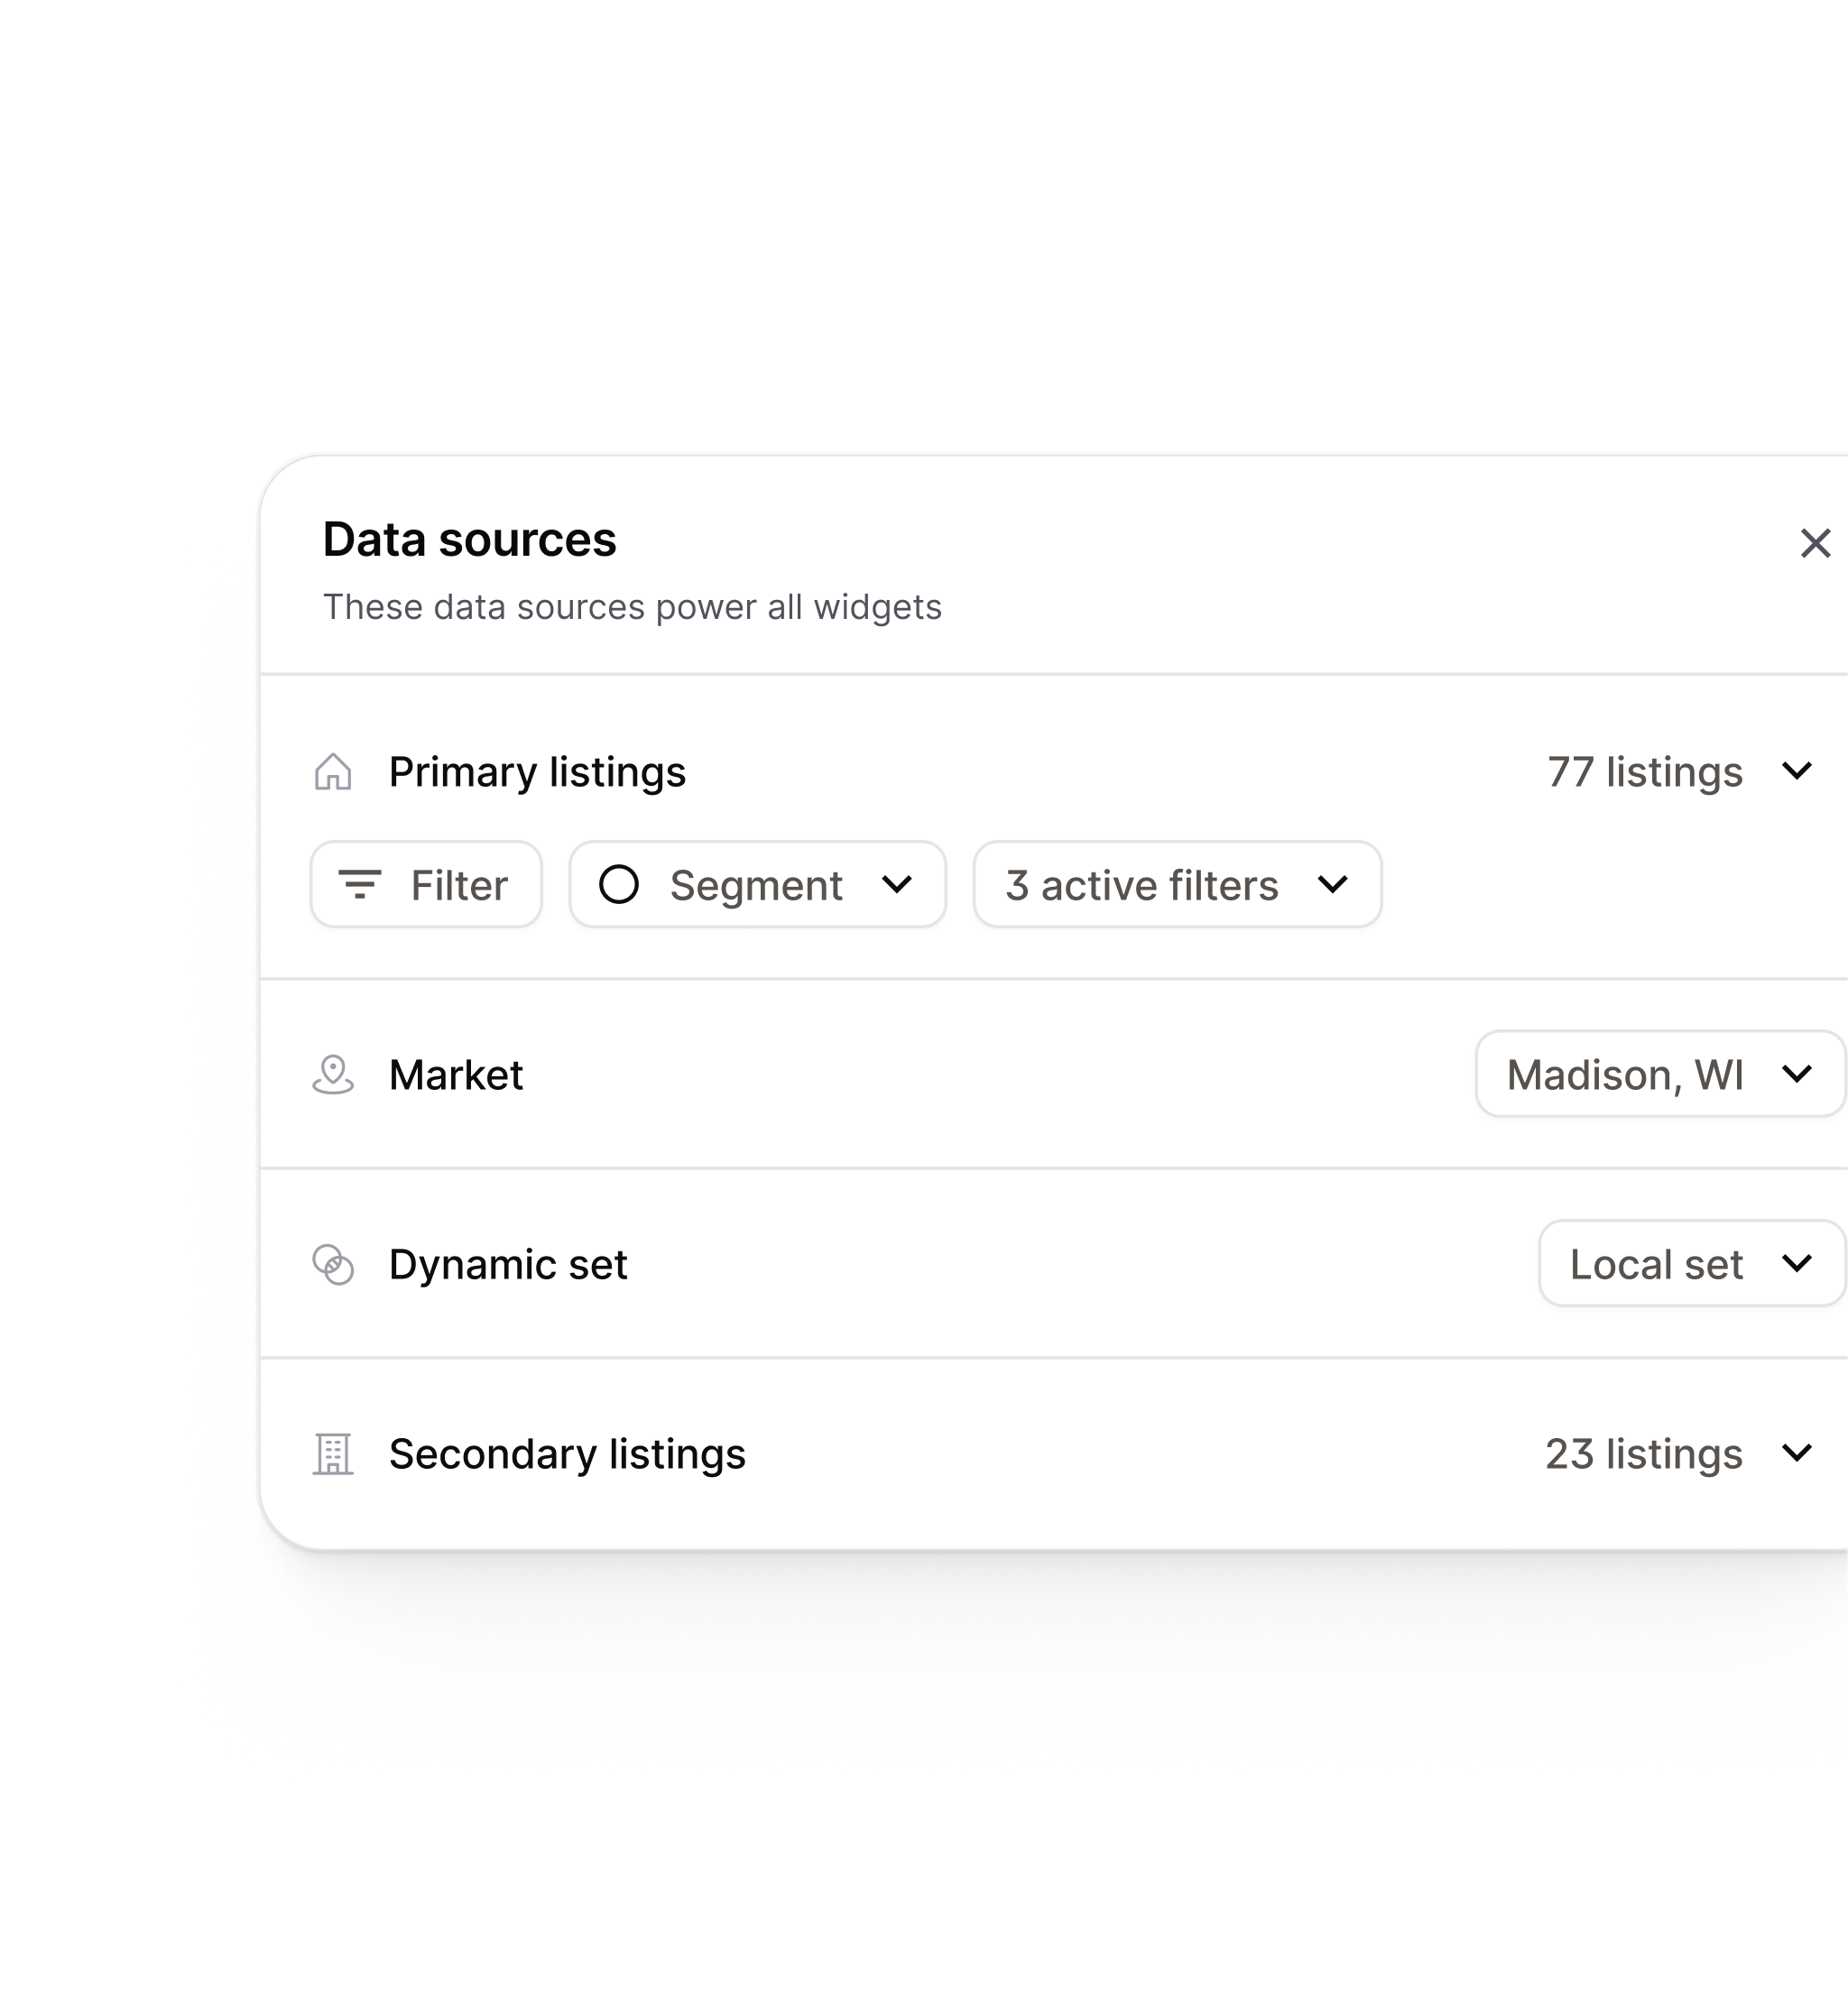
Data Sources & Metrics
Combine data from listings, market, and dynamic sets to unlock a complete view of performance across every key metric.
Filtering, segments and time periods
Shape your narrative with precision—apply filters, segments, and time frames to uncover insights and surface the story behind your data.
Summarize & take note
Add notes and summaries to connect the dots between your charts and data—turning raw numbers into a cohesive story.
Collaboration
Share snapshots, comment, and move forward as a team
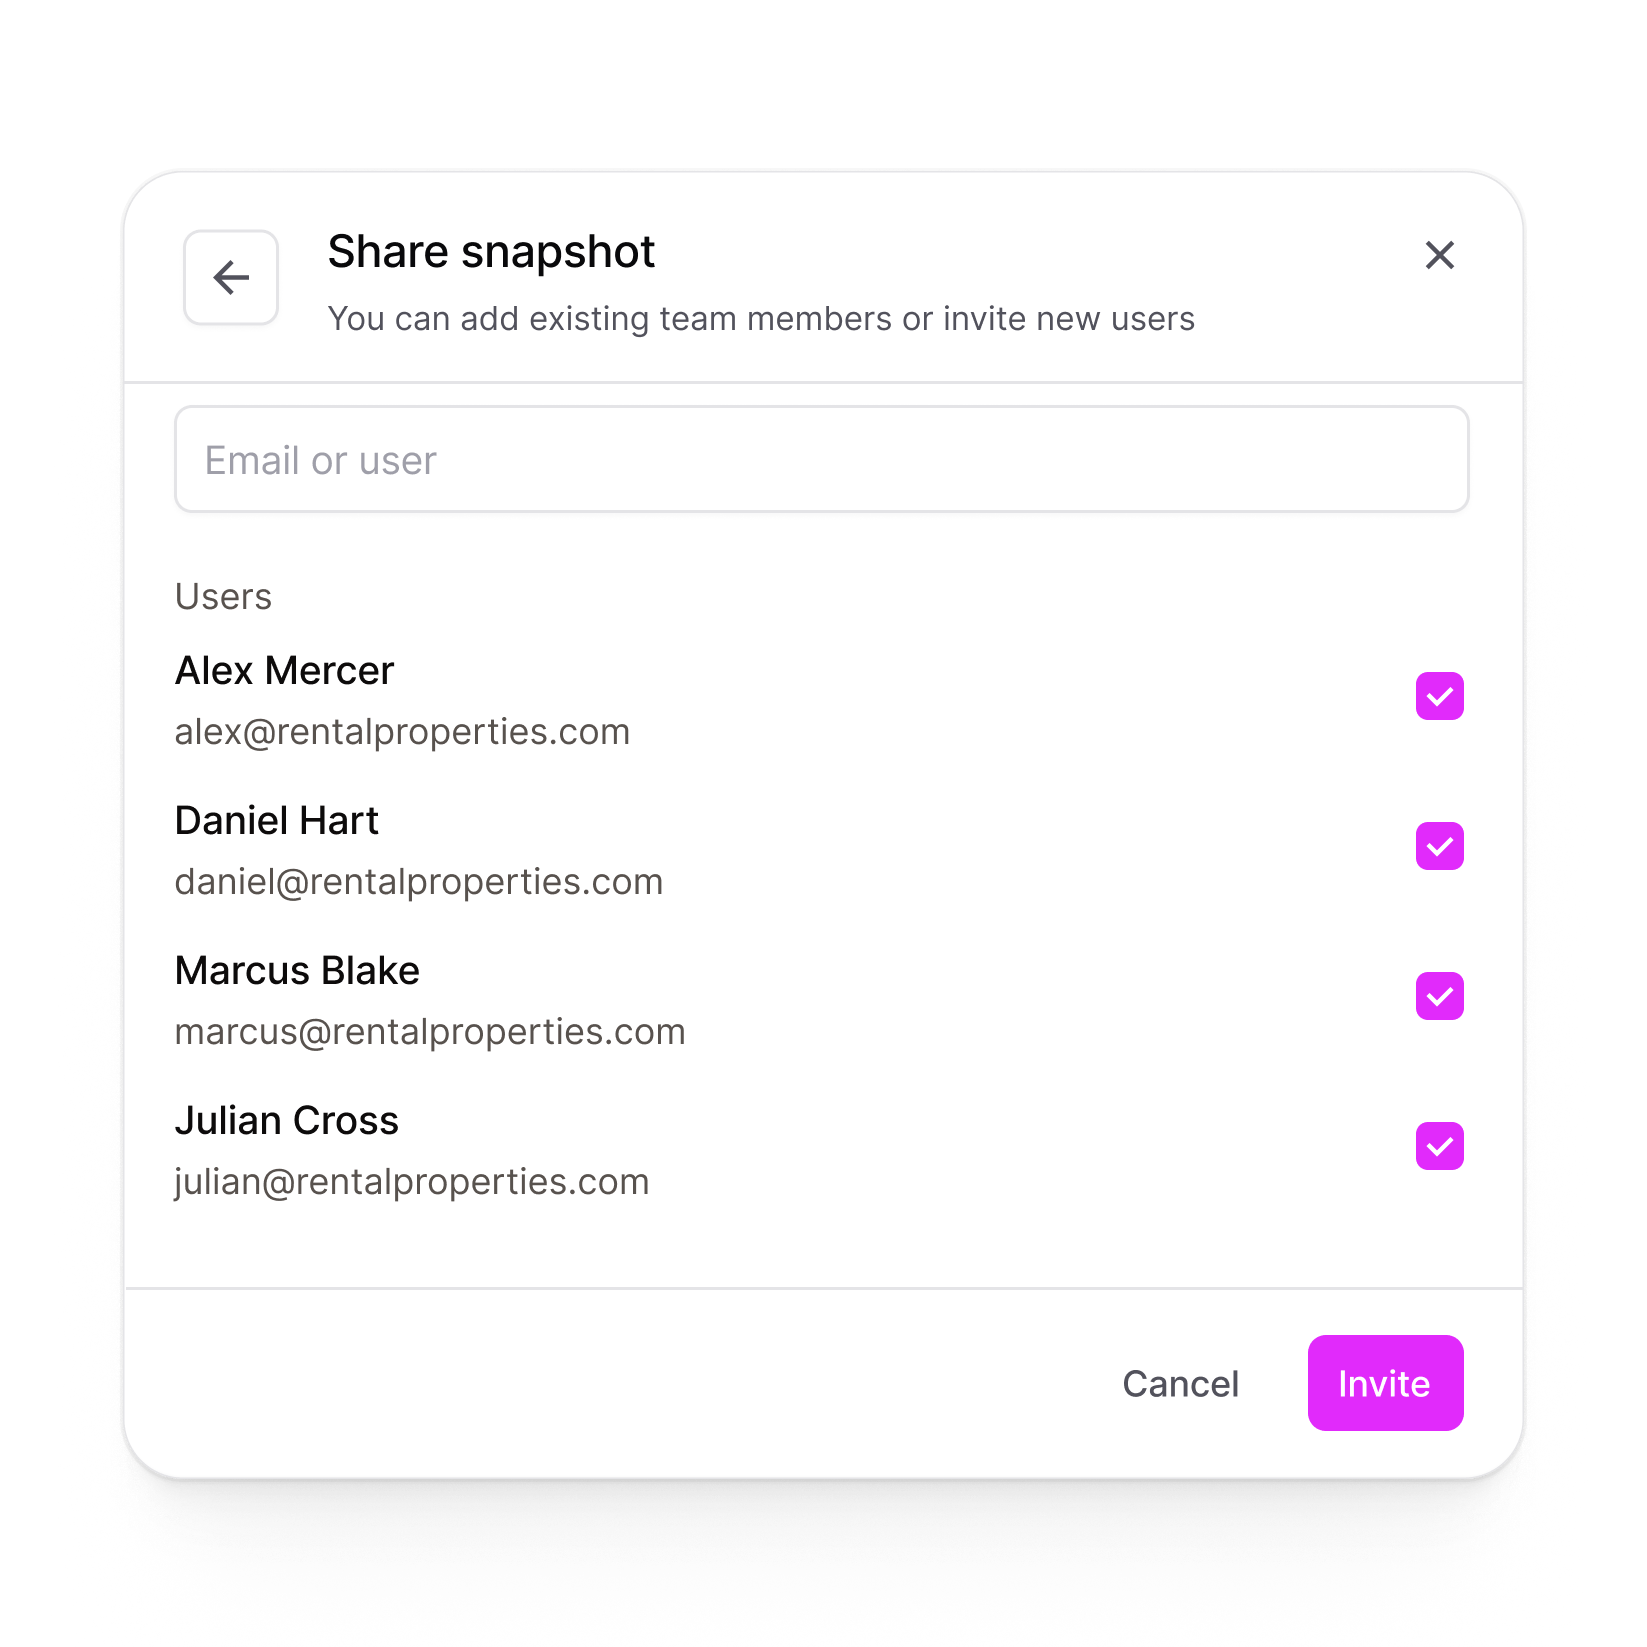
Share with your team (and others)
Share your report as a snapshot—invite teammates to explore it together or export a polished PDF for easy distribution.
Streamline feedback
Streamline collaboration with in-app commenting—discuss insights, ask questions, and keep every conversation tied to the data it’s about.
Take action
Close the loop from insight to impact. Take action on your discussions—update pricing, open nights, and optimize performance with confidence.
Move faster with pre-built templates

Know Your Numbers
Track the core metrics that define your portfolio’s health — ADR, Occupancy, RevPAR, Revenue, and more. Quickly spot trends, strengths, and areas to improve across your listings.
See Your Share
Compare your performance to the broader market with KPI cards, trend charts, and benchmark tables. Understand how well you’re capturing demand and where pricing or pacing adjustments could help.
Win Your Lane
Measure your portfolio directly against similar listings. Identify where you’re outperforming, where you’re behind, and how to refine your strategy to gain a competitive edge.